如何在 WebStorm 對 Angular 下中斷點 Debug?
直接在 IDE 下中斷點 debug
Contents
WebStorm 允許我們如同 Visual Studio 一樣,直接在 IDE 內設定中斷點,並停止執行在那一行,我們可觀察當時的變數,也可使用 step over、step into、step out 等除錯技巧,重點是它是停止在 TypeScript 上,而非 JavaScript 上。
Version
WebStorm 2017.1.2
Angular CLI 1.0.1
Angular 4.1.0
Installation
安裝 Chrome Extension
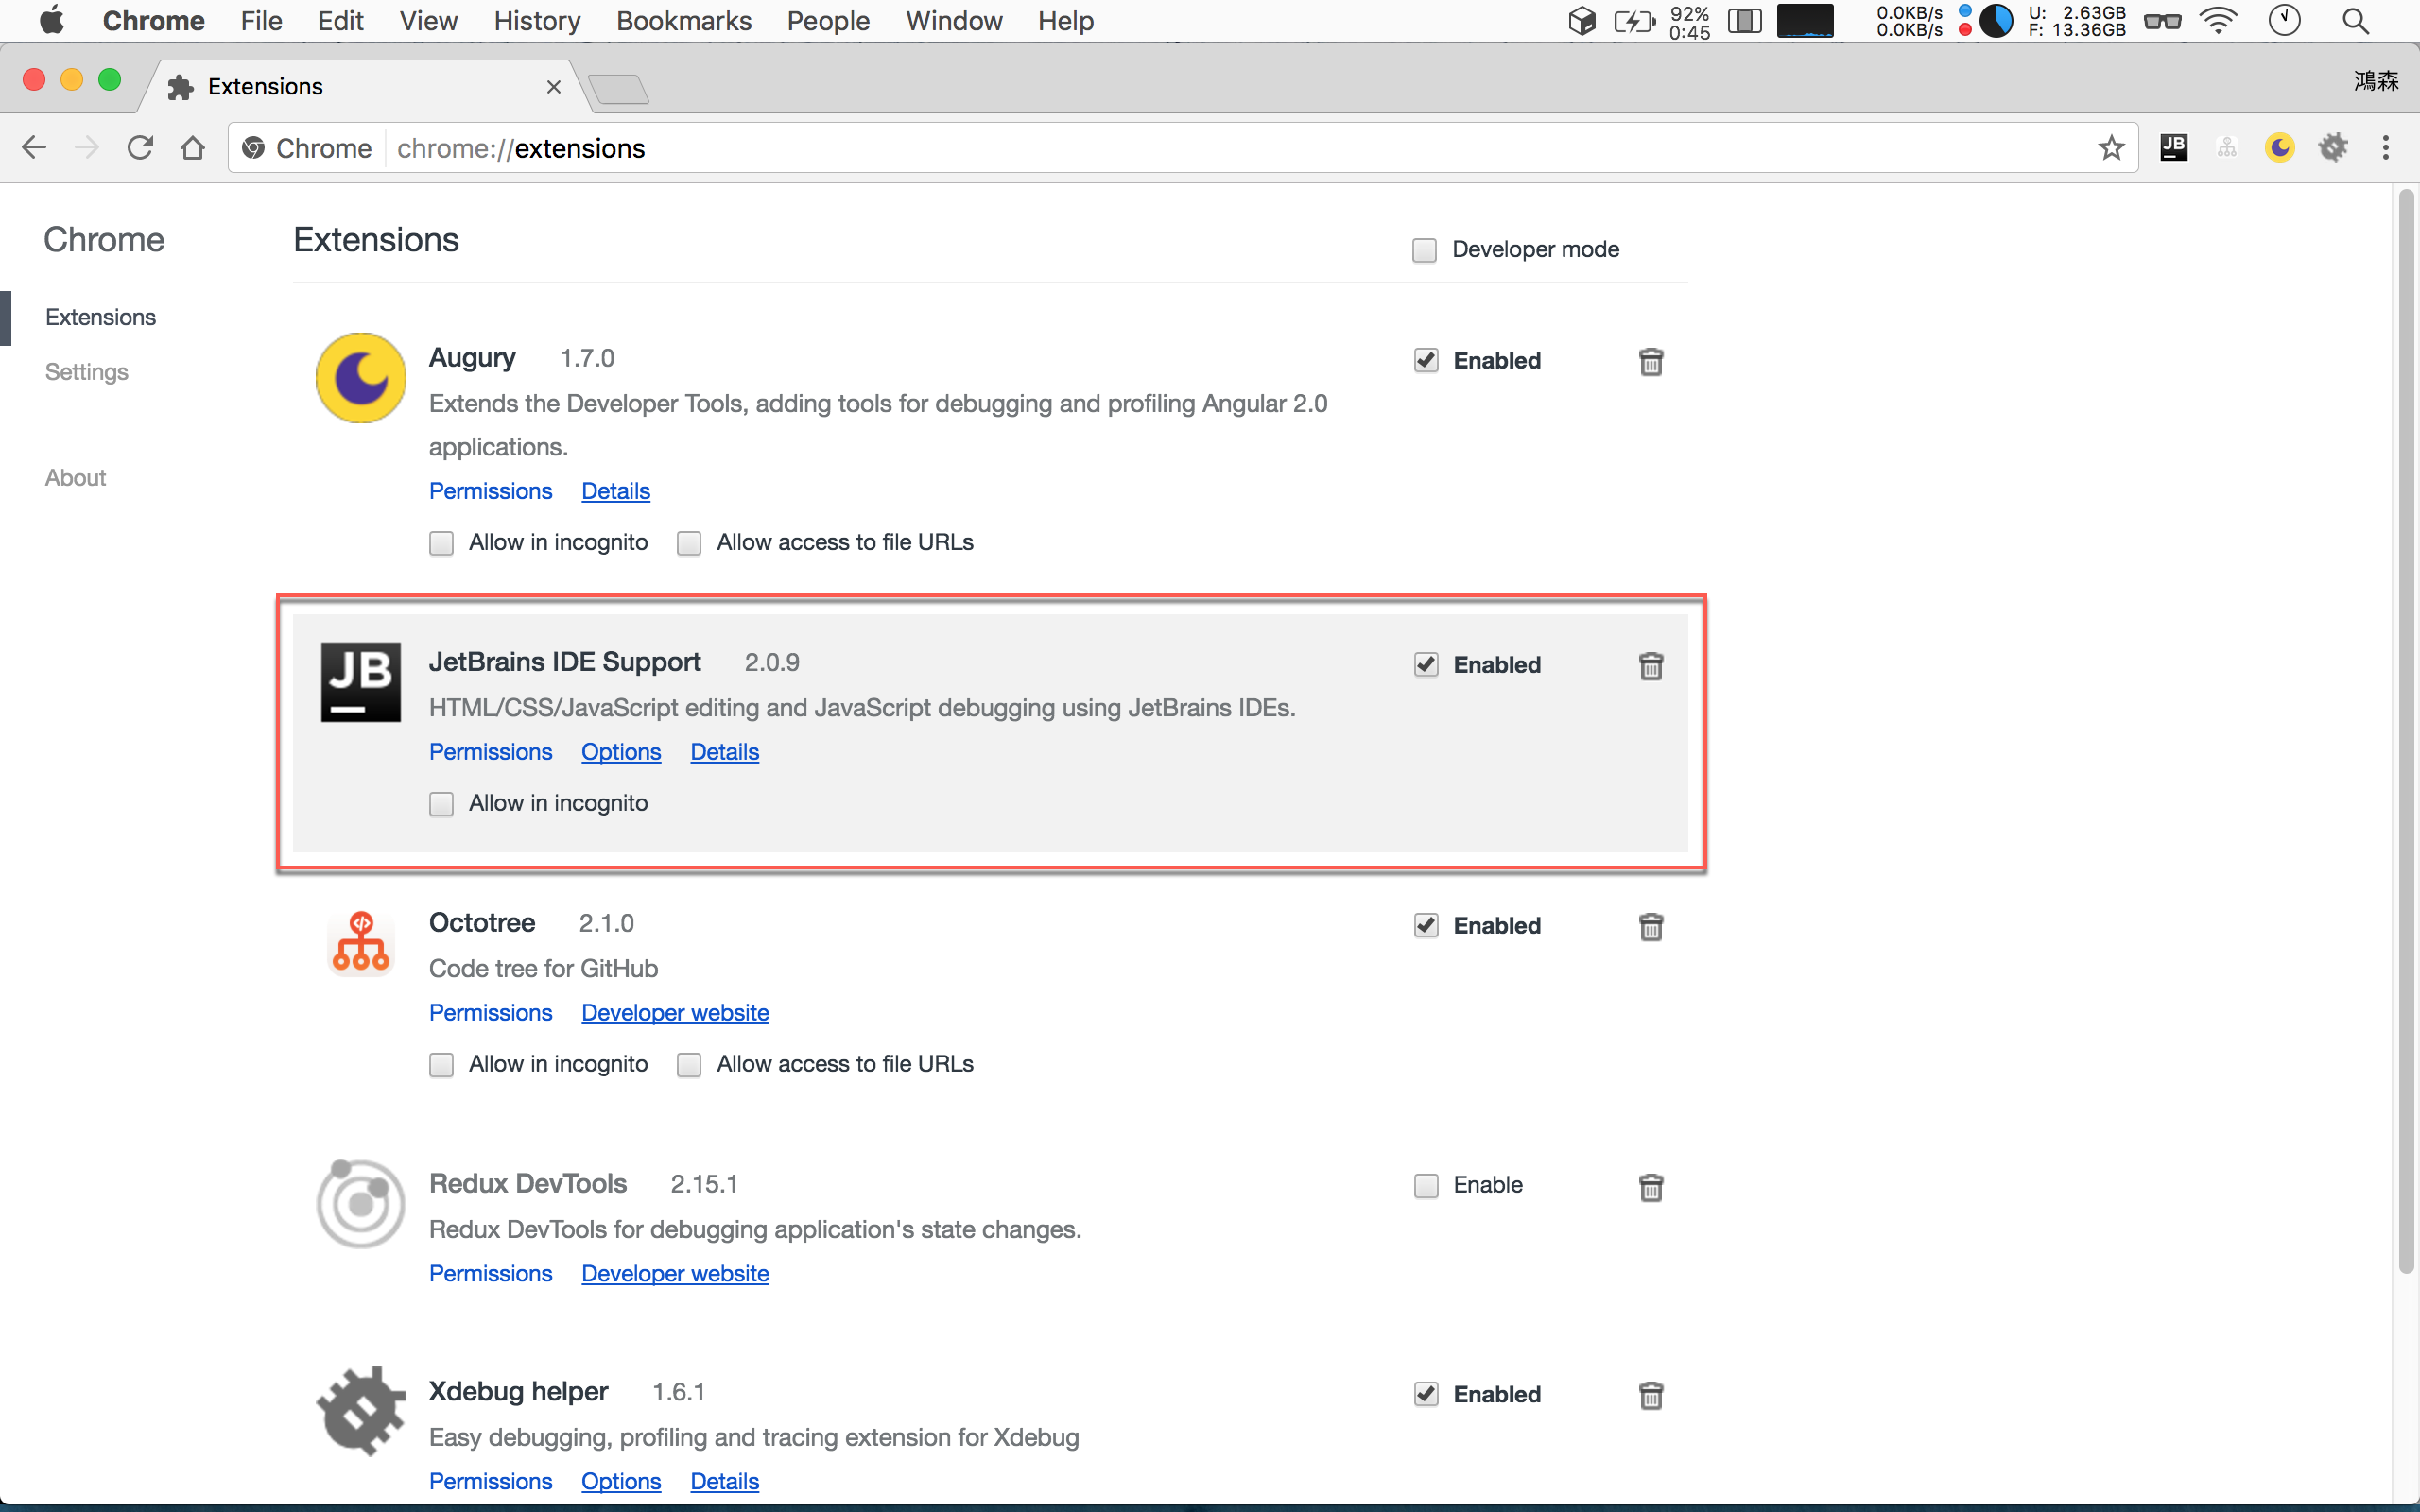
安裝 JetBrains IDE Support Chrome extension。
WebStorm 設定
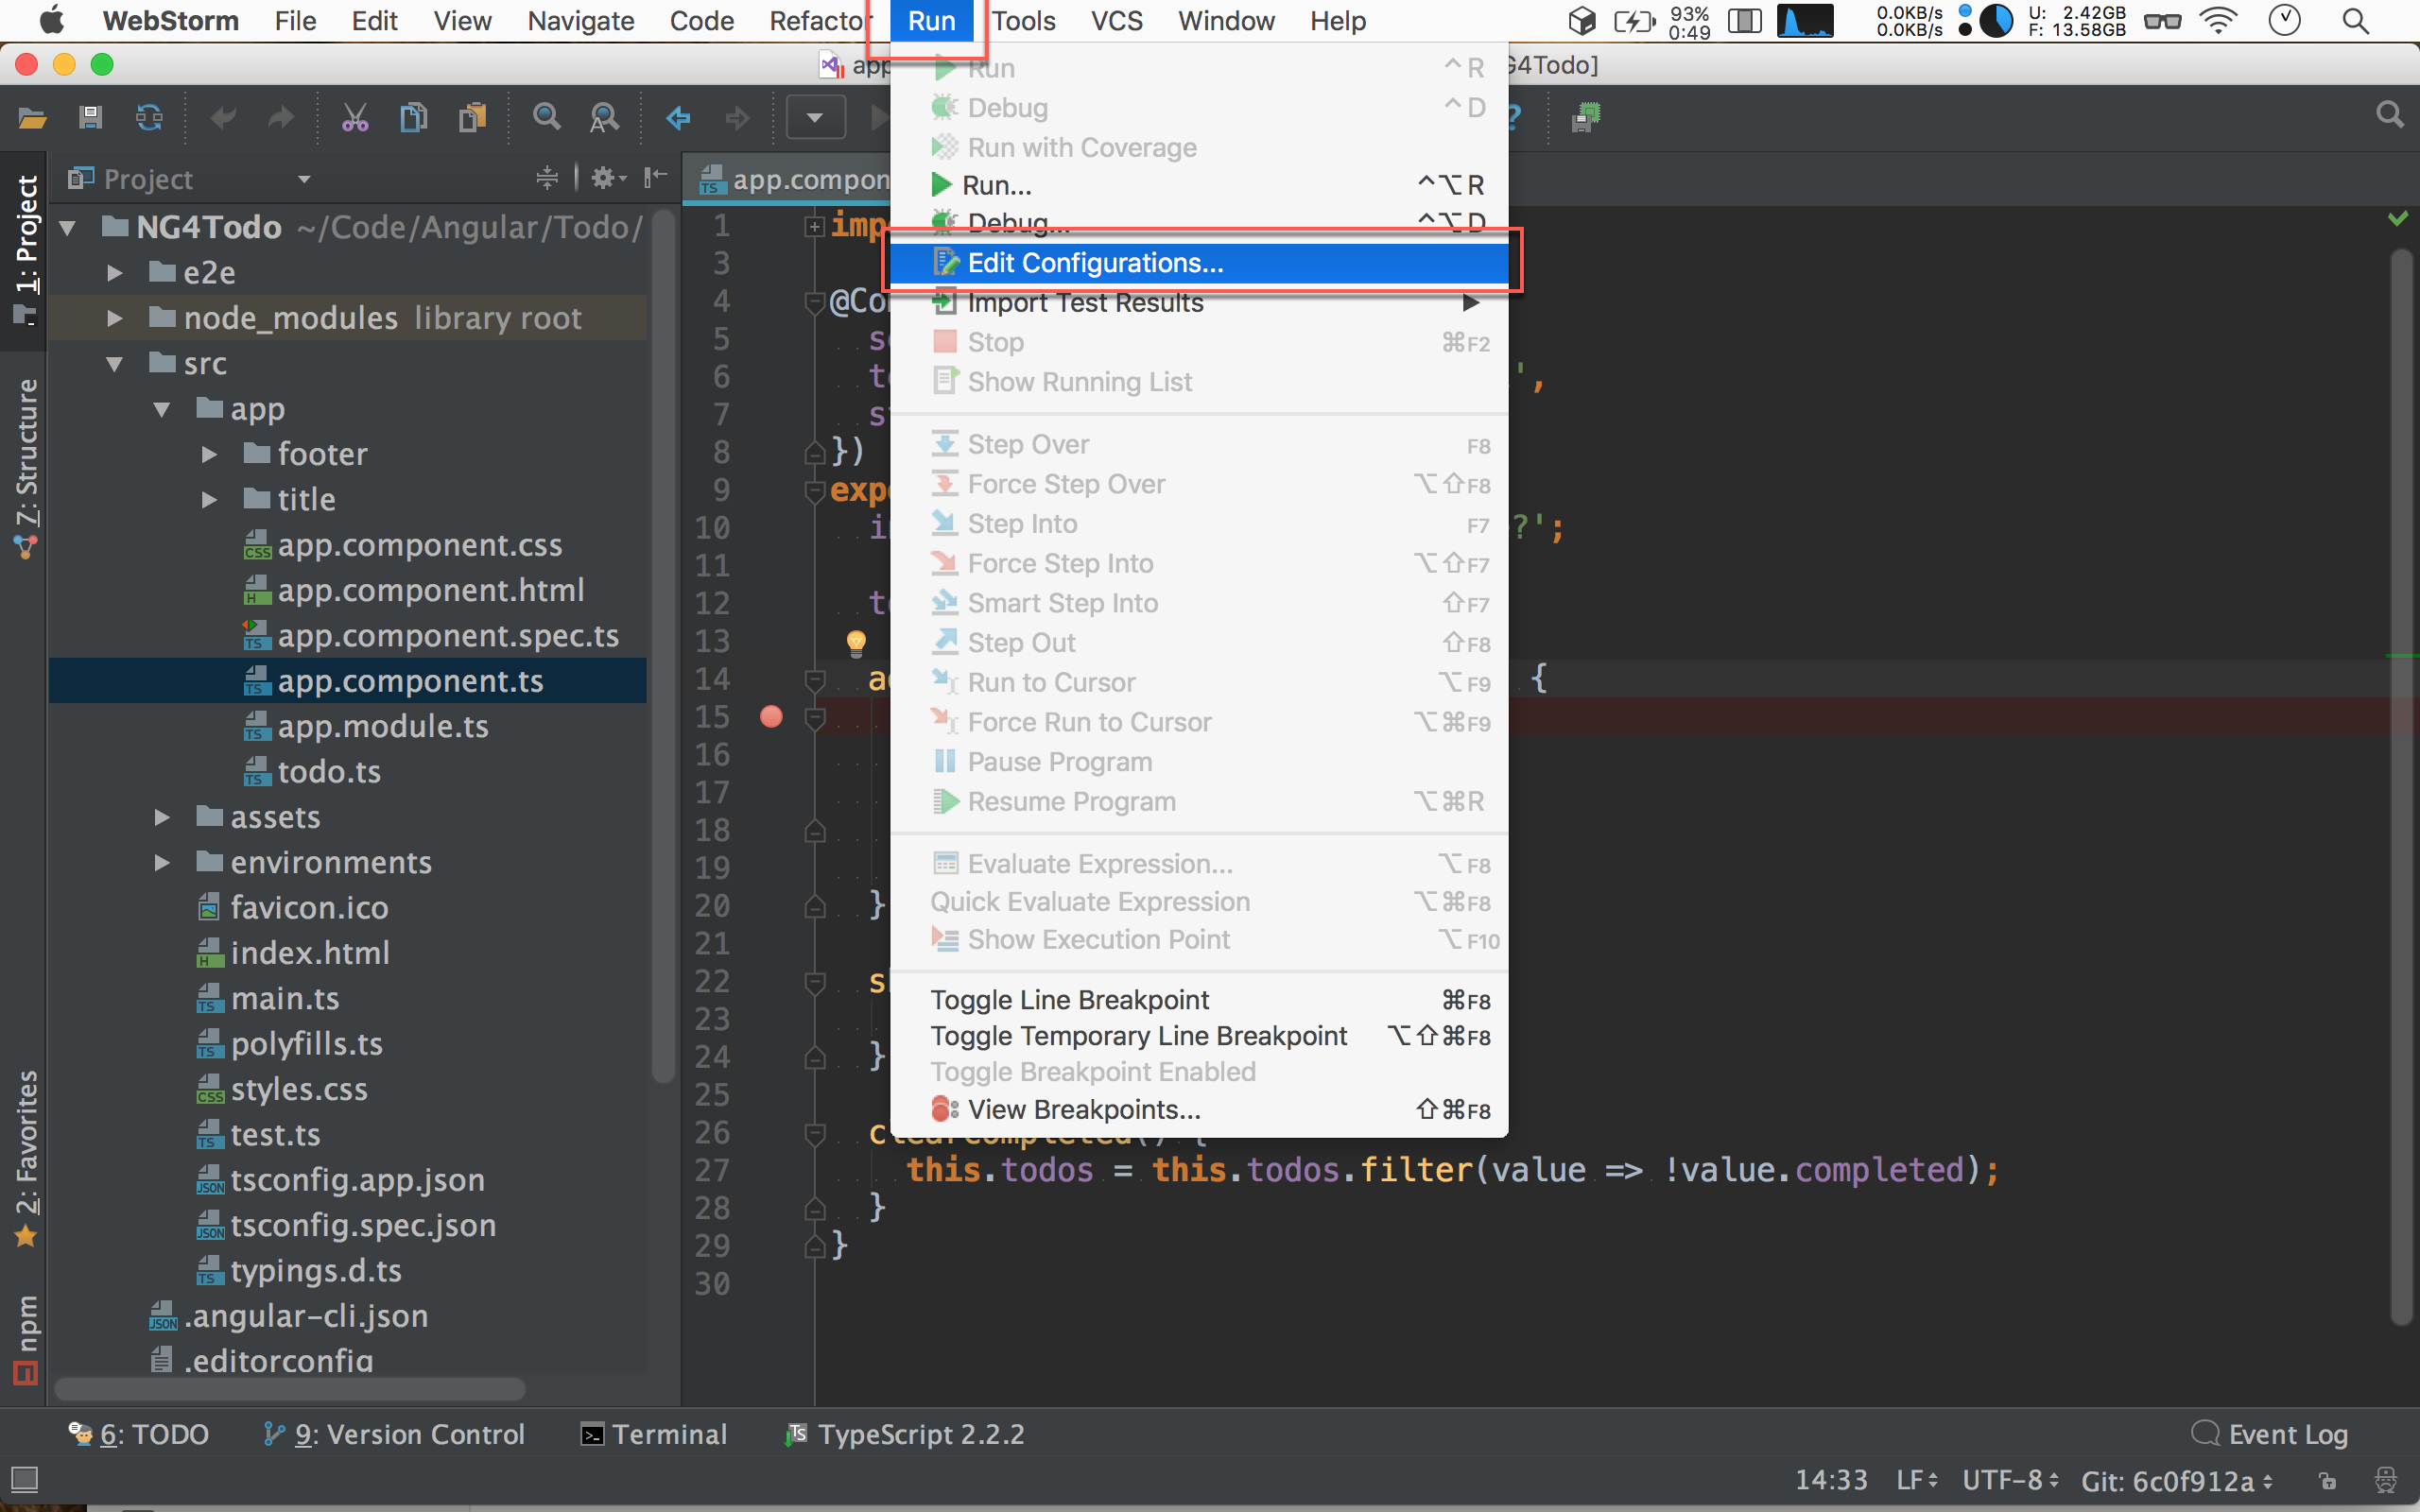
Run -> Edit Configurations…
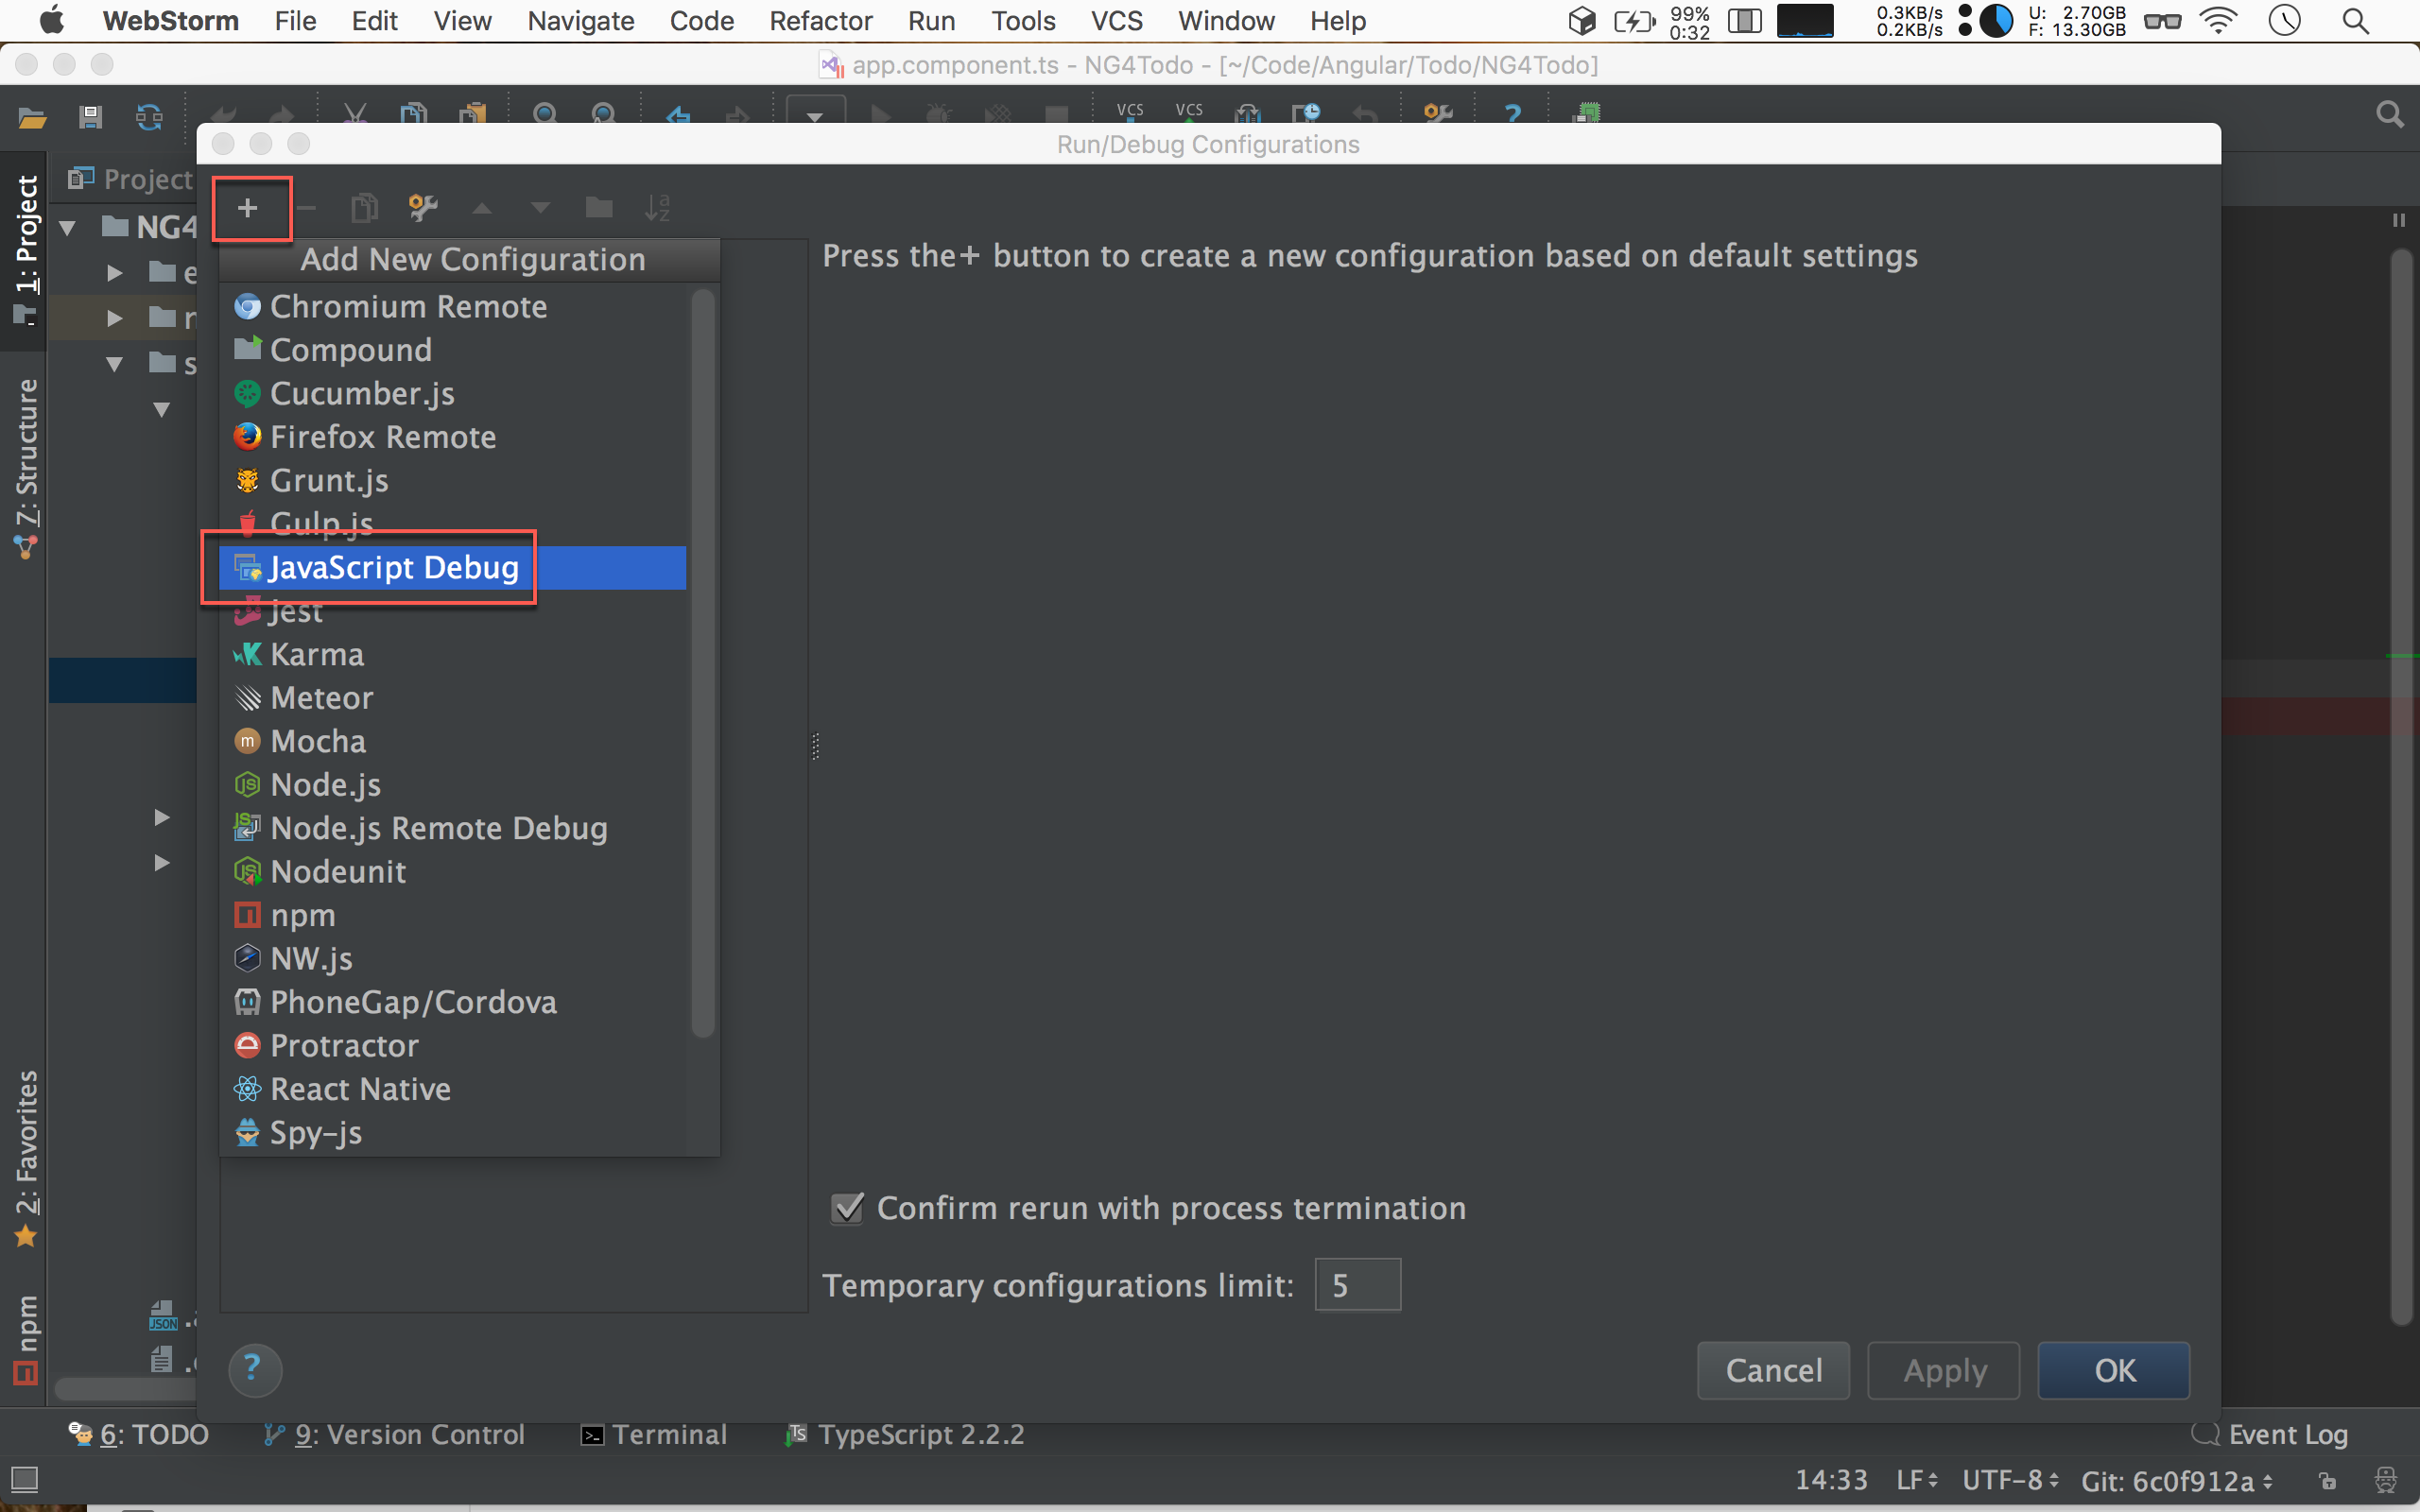
按左上角的 +,選擇 JavaScript Debug。
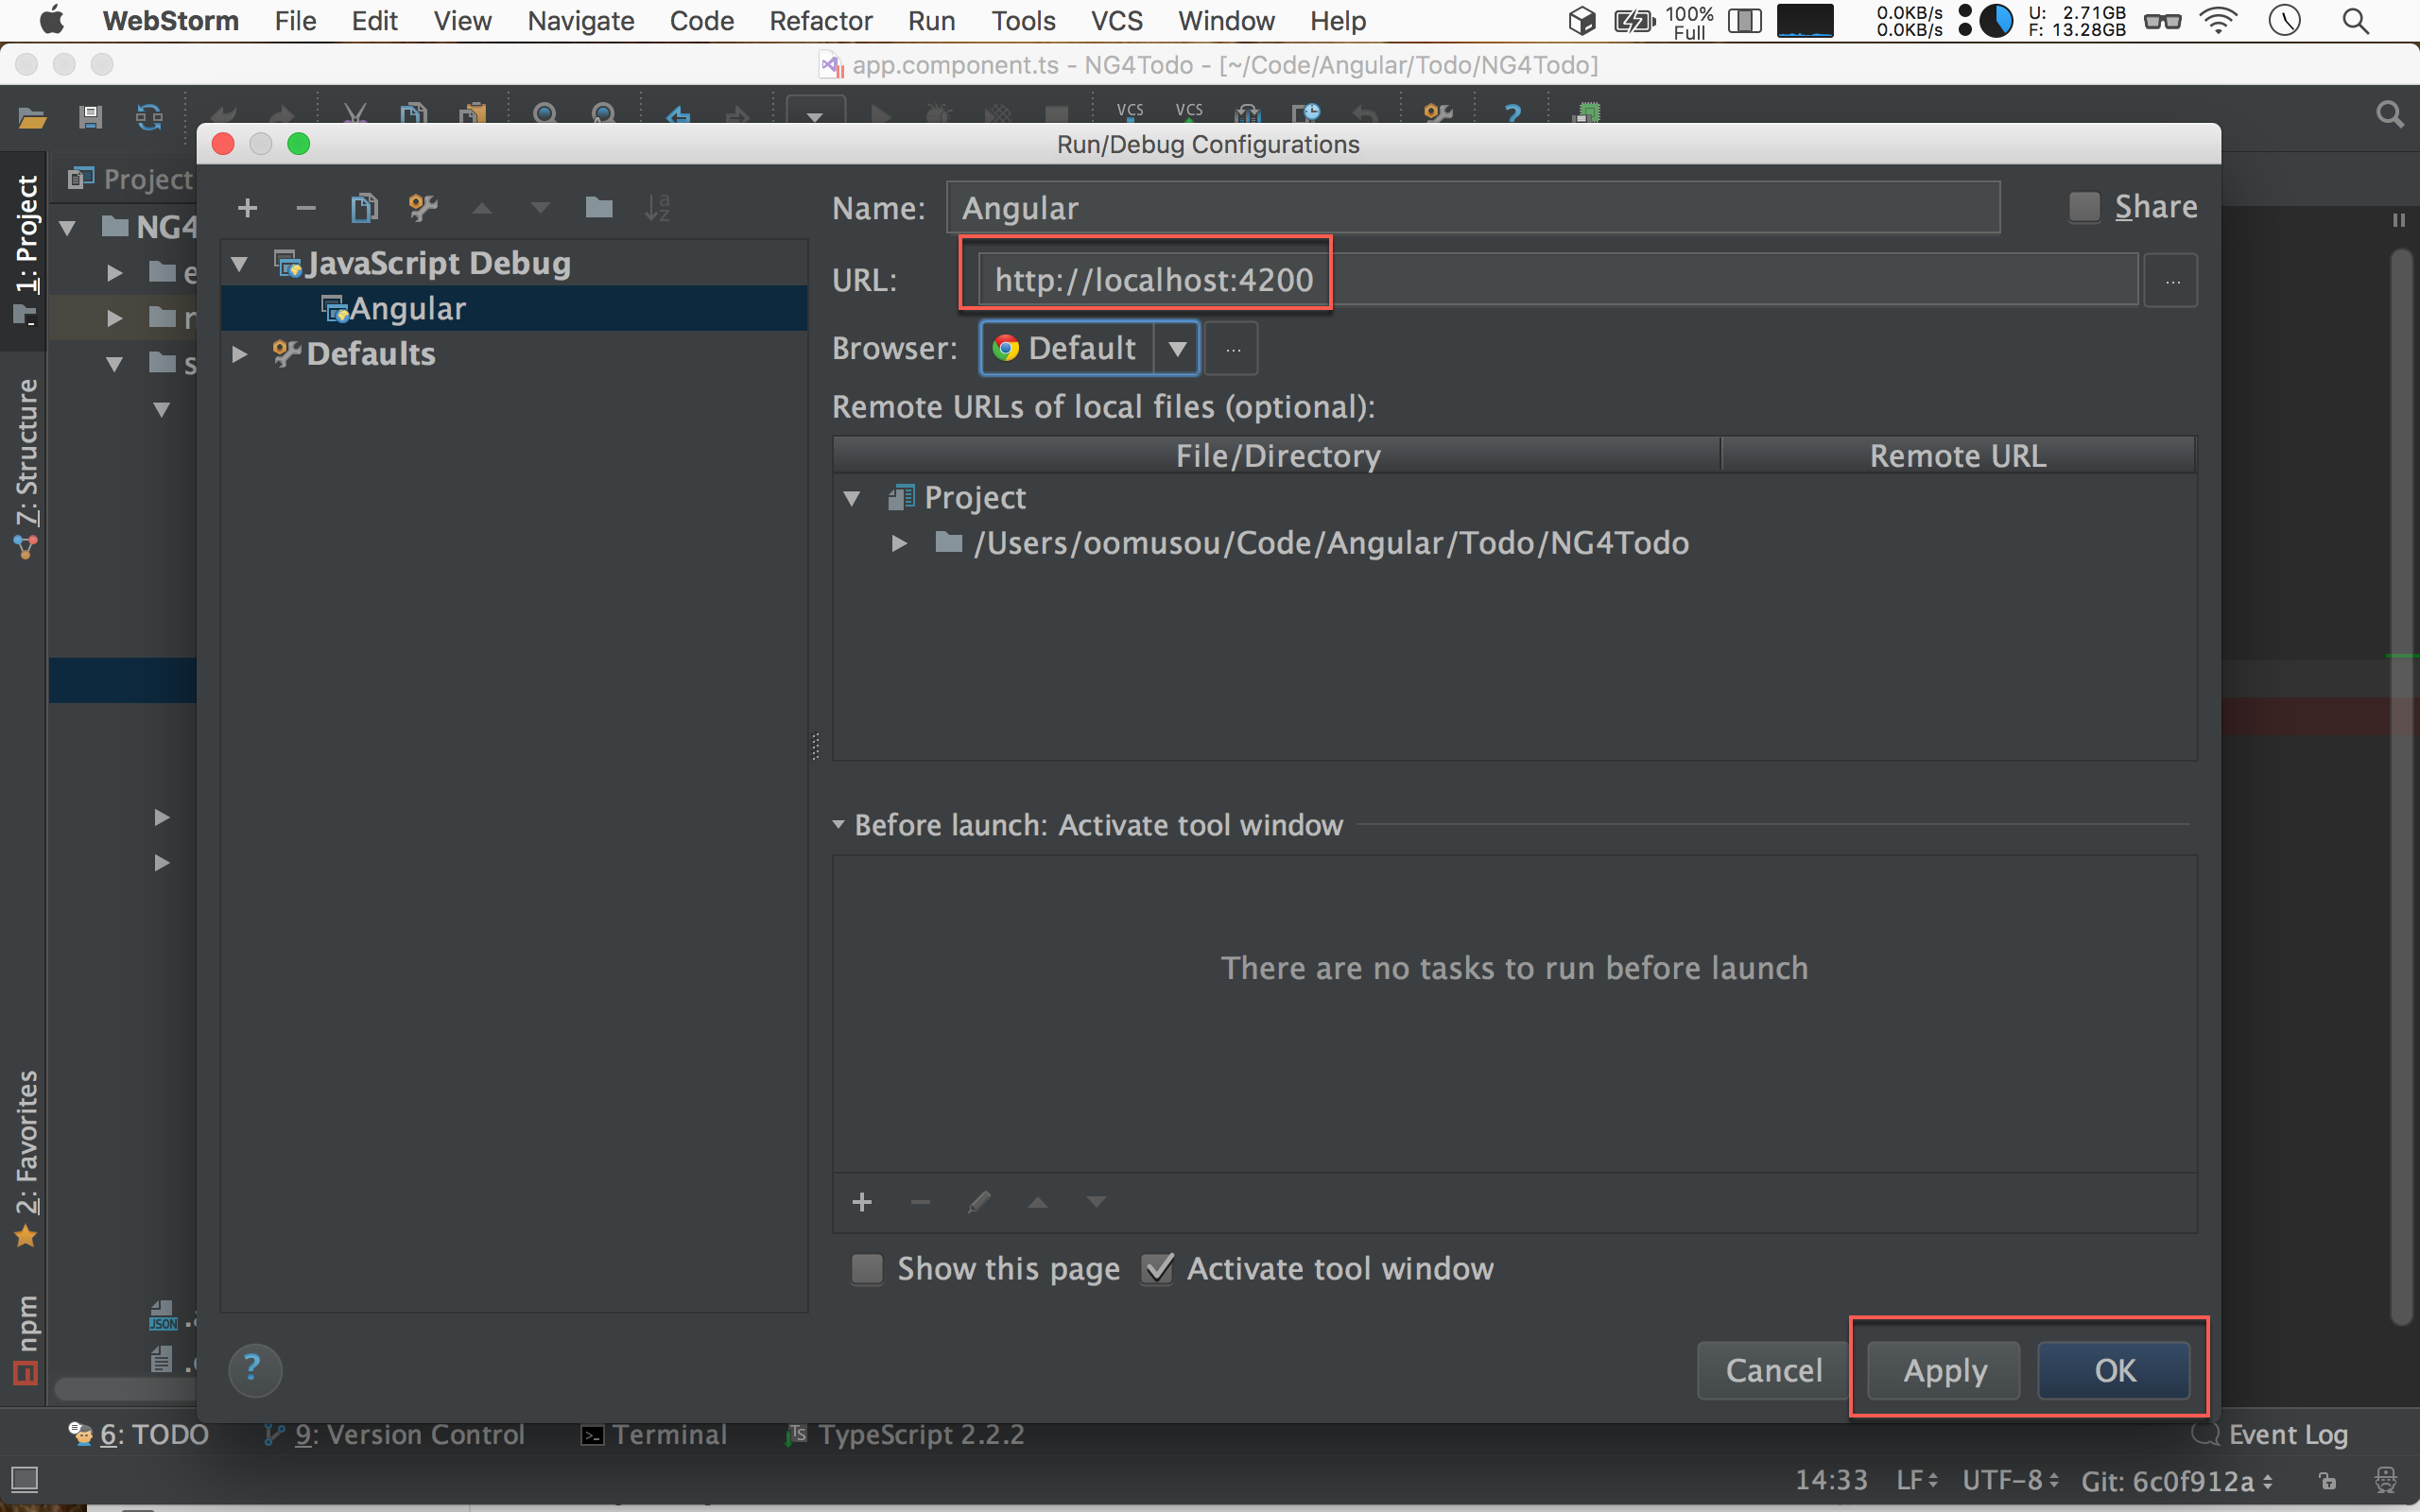
- URL : 輸入
http://localhost:4200。
按 Apply 與 OK 繼續。
Debug
設定 TypeScript 中斷點
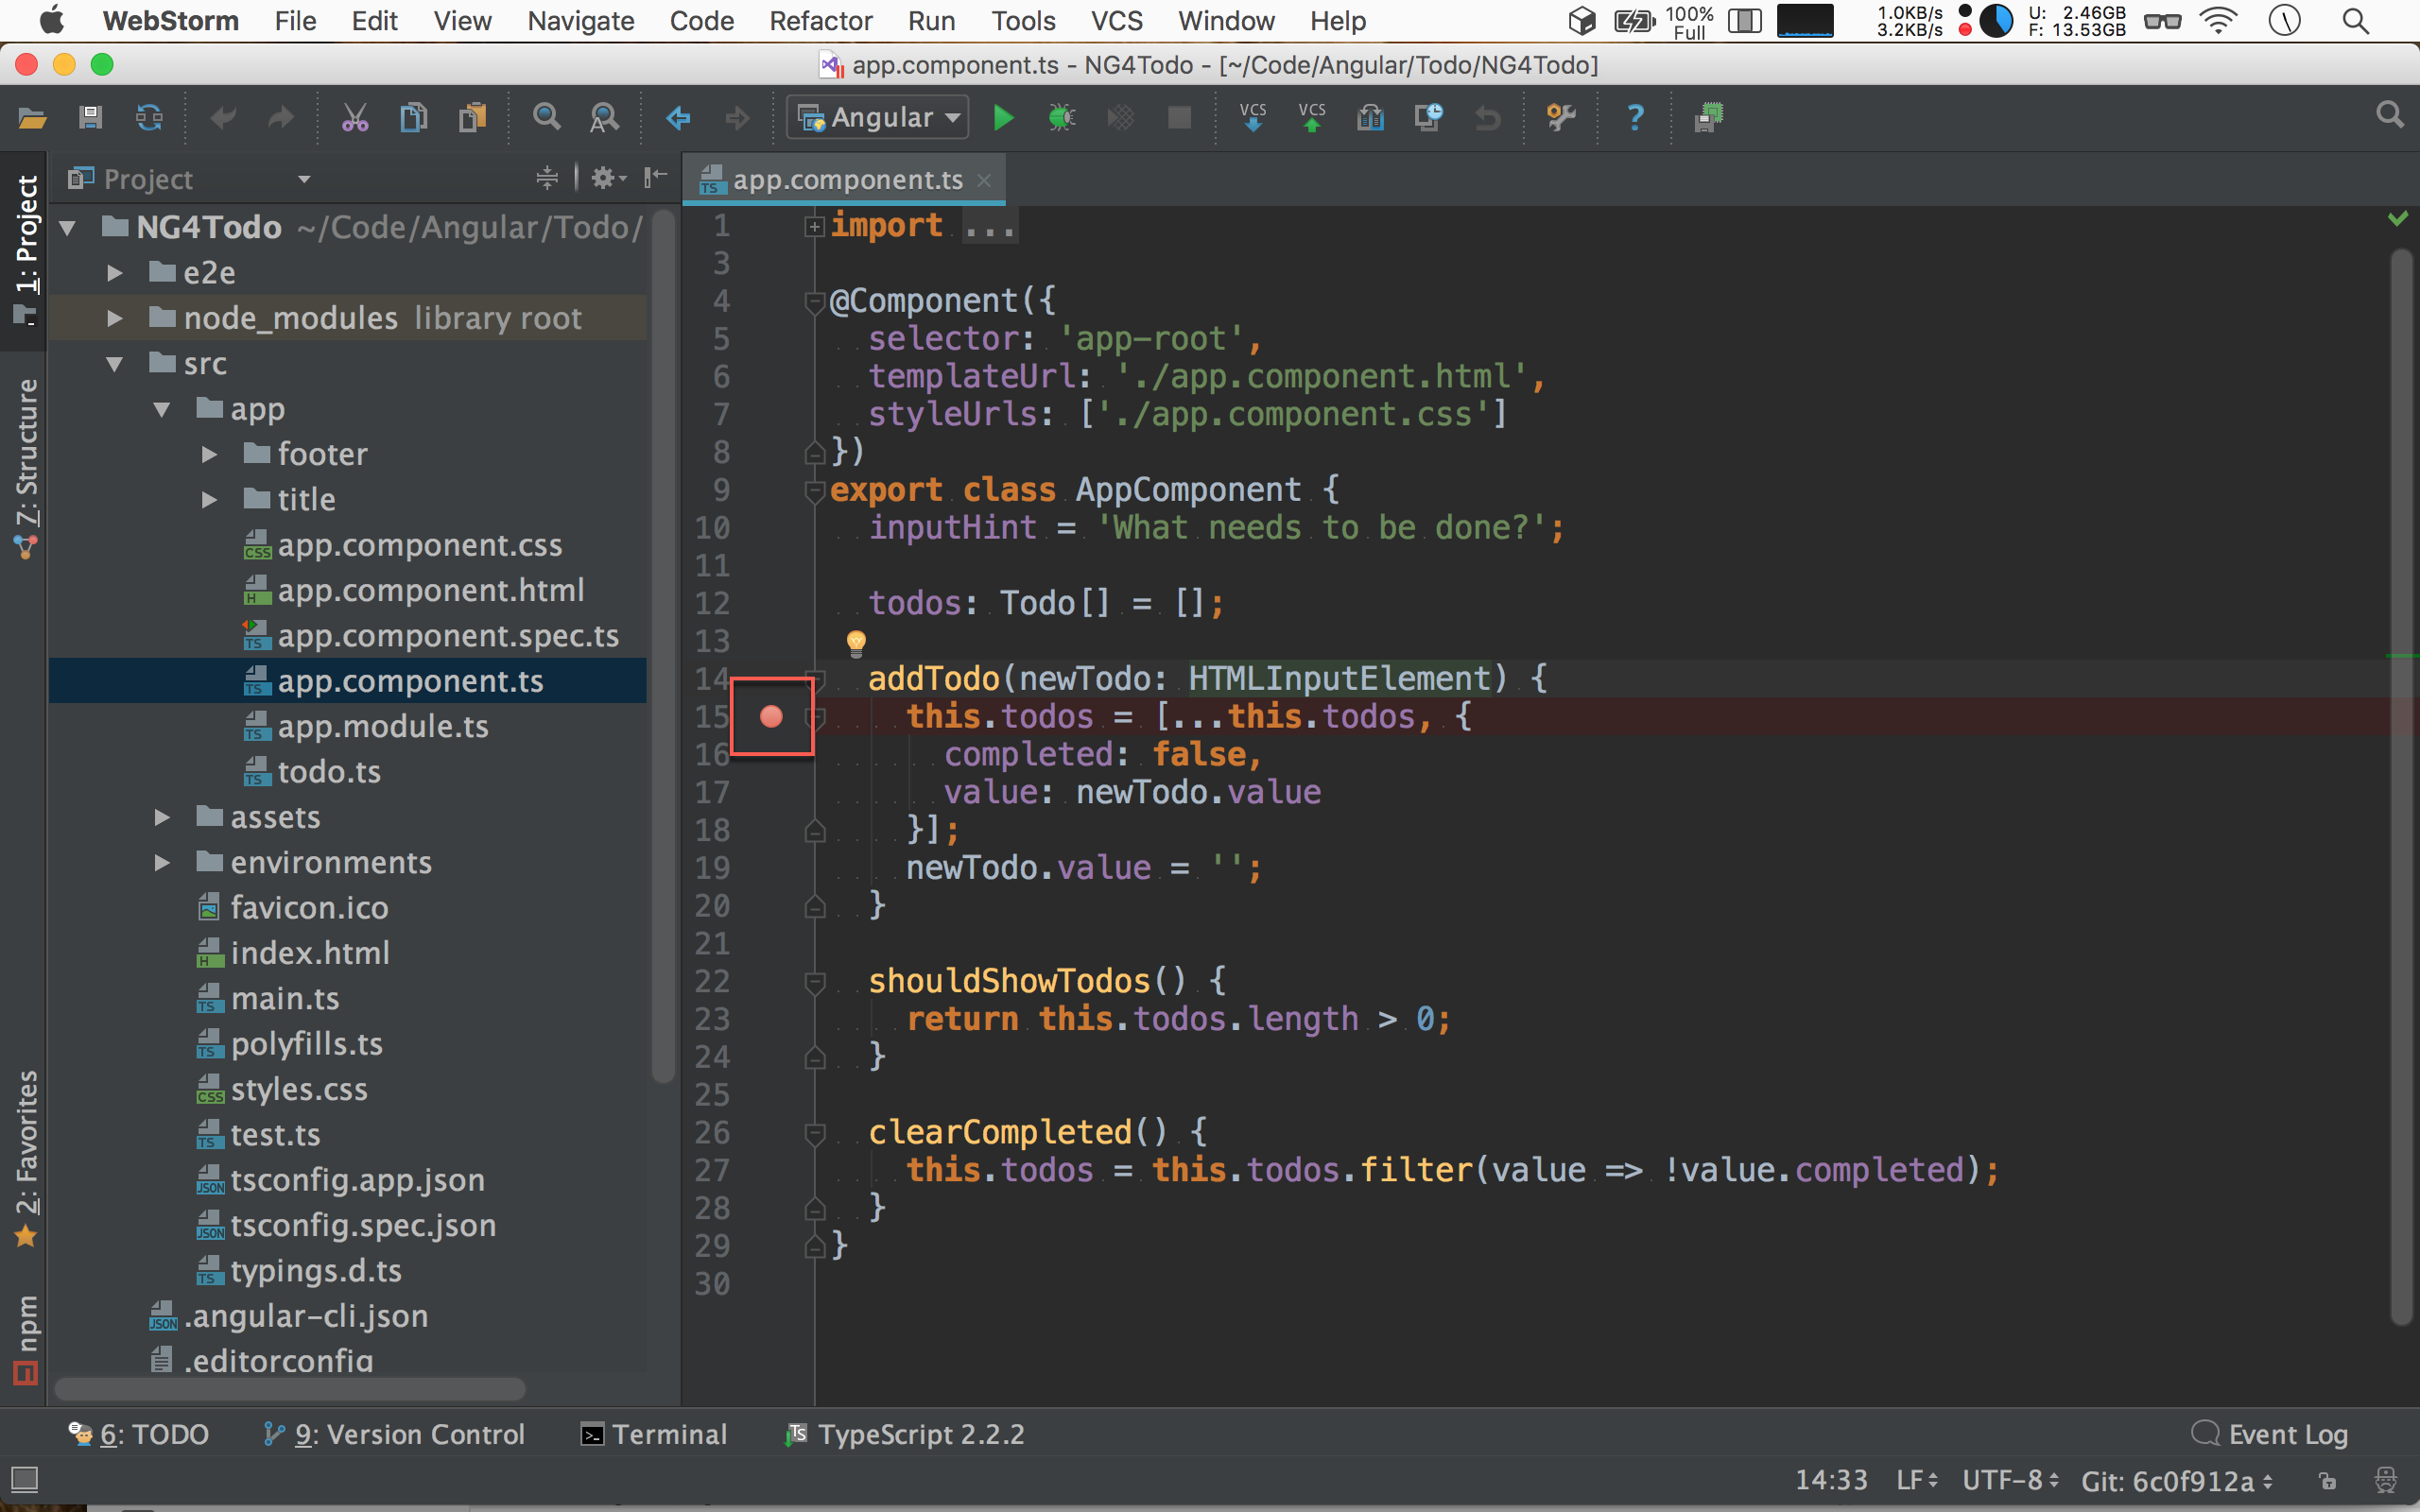
在任意 TypeScript 你想停止的地方,加上中斷點。
開始 Debug
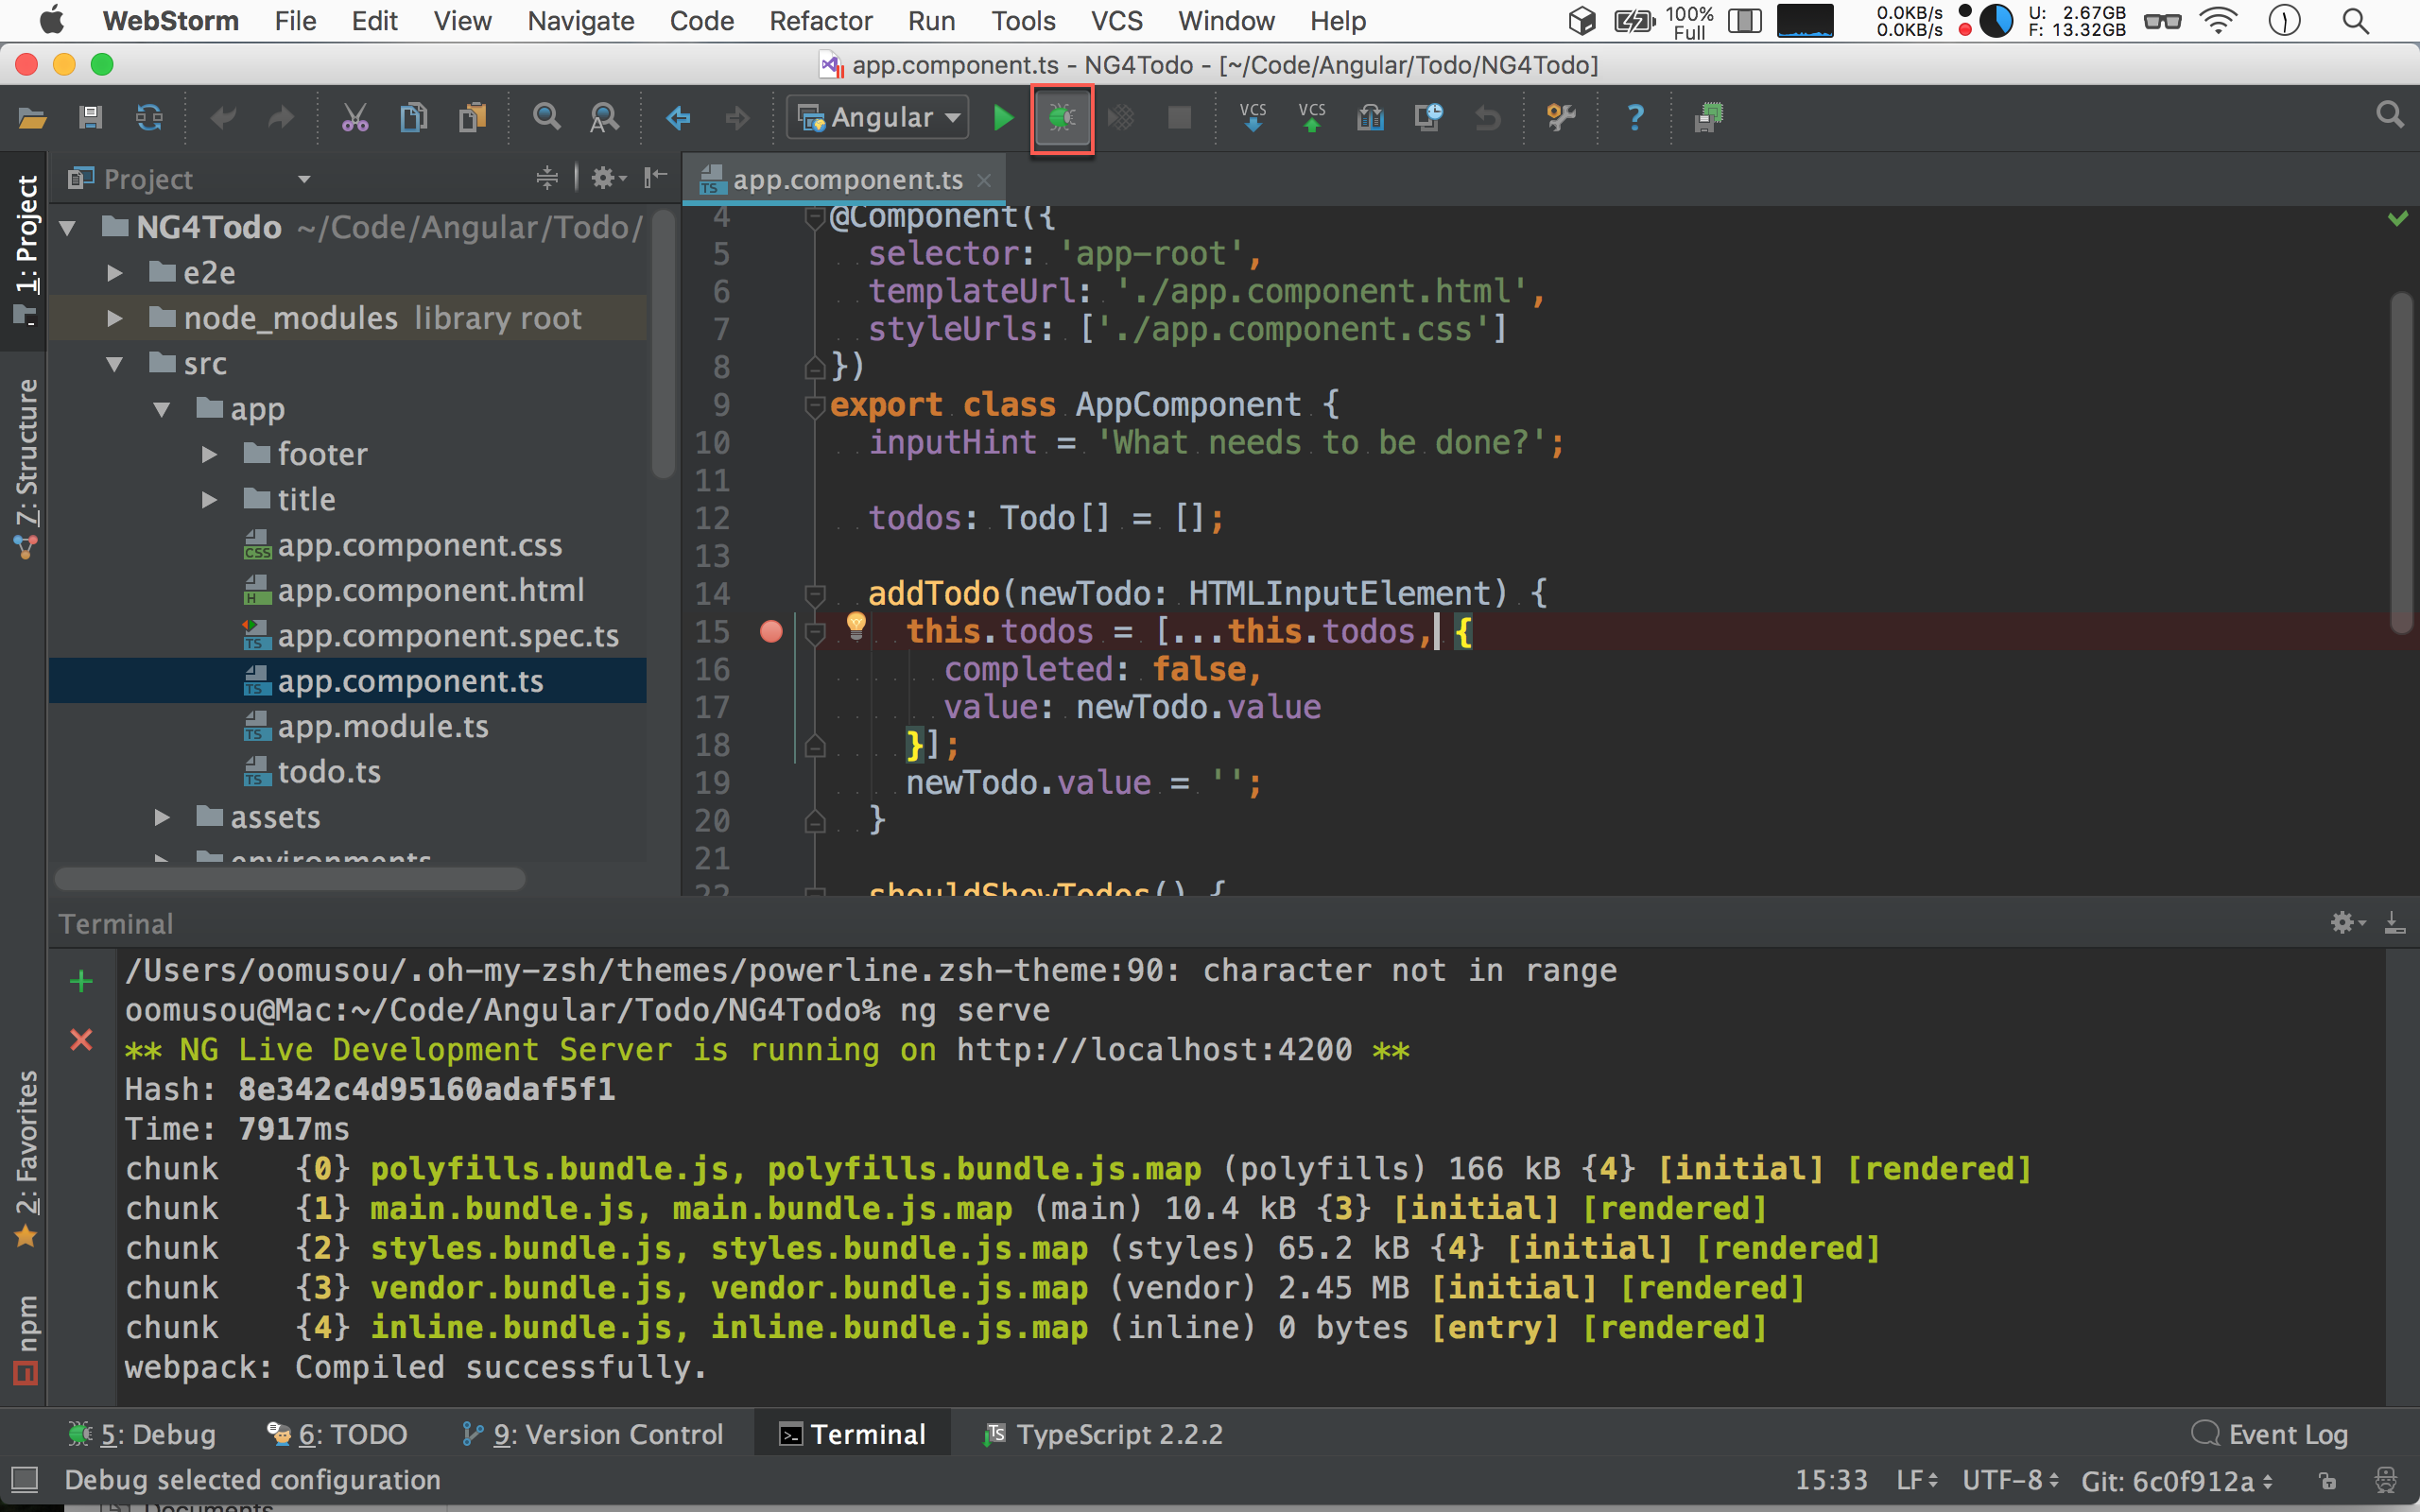
使用 ng serve 啟動 Angular CLI 內建 web server,並按下上方的 瓢蟲 開始 debug。
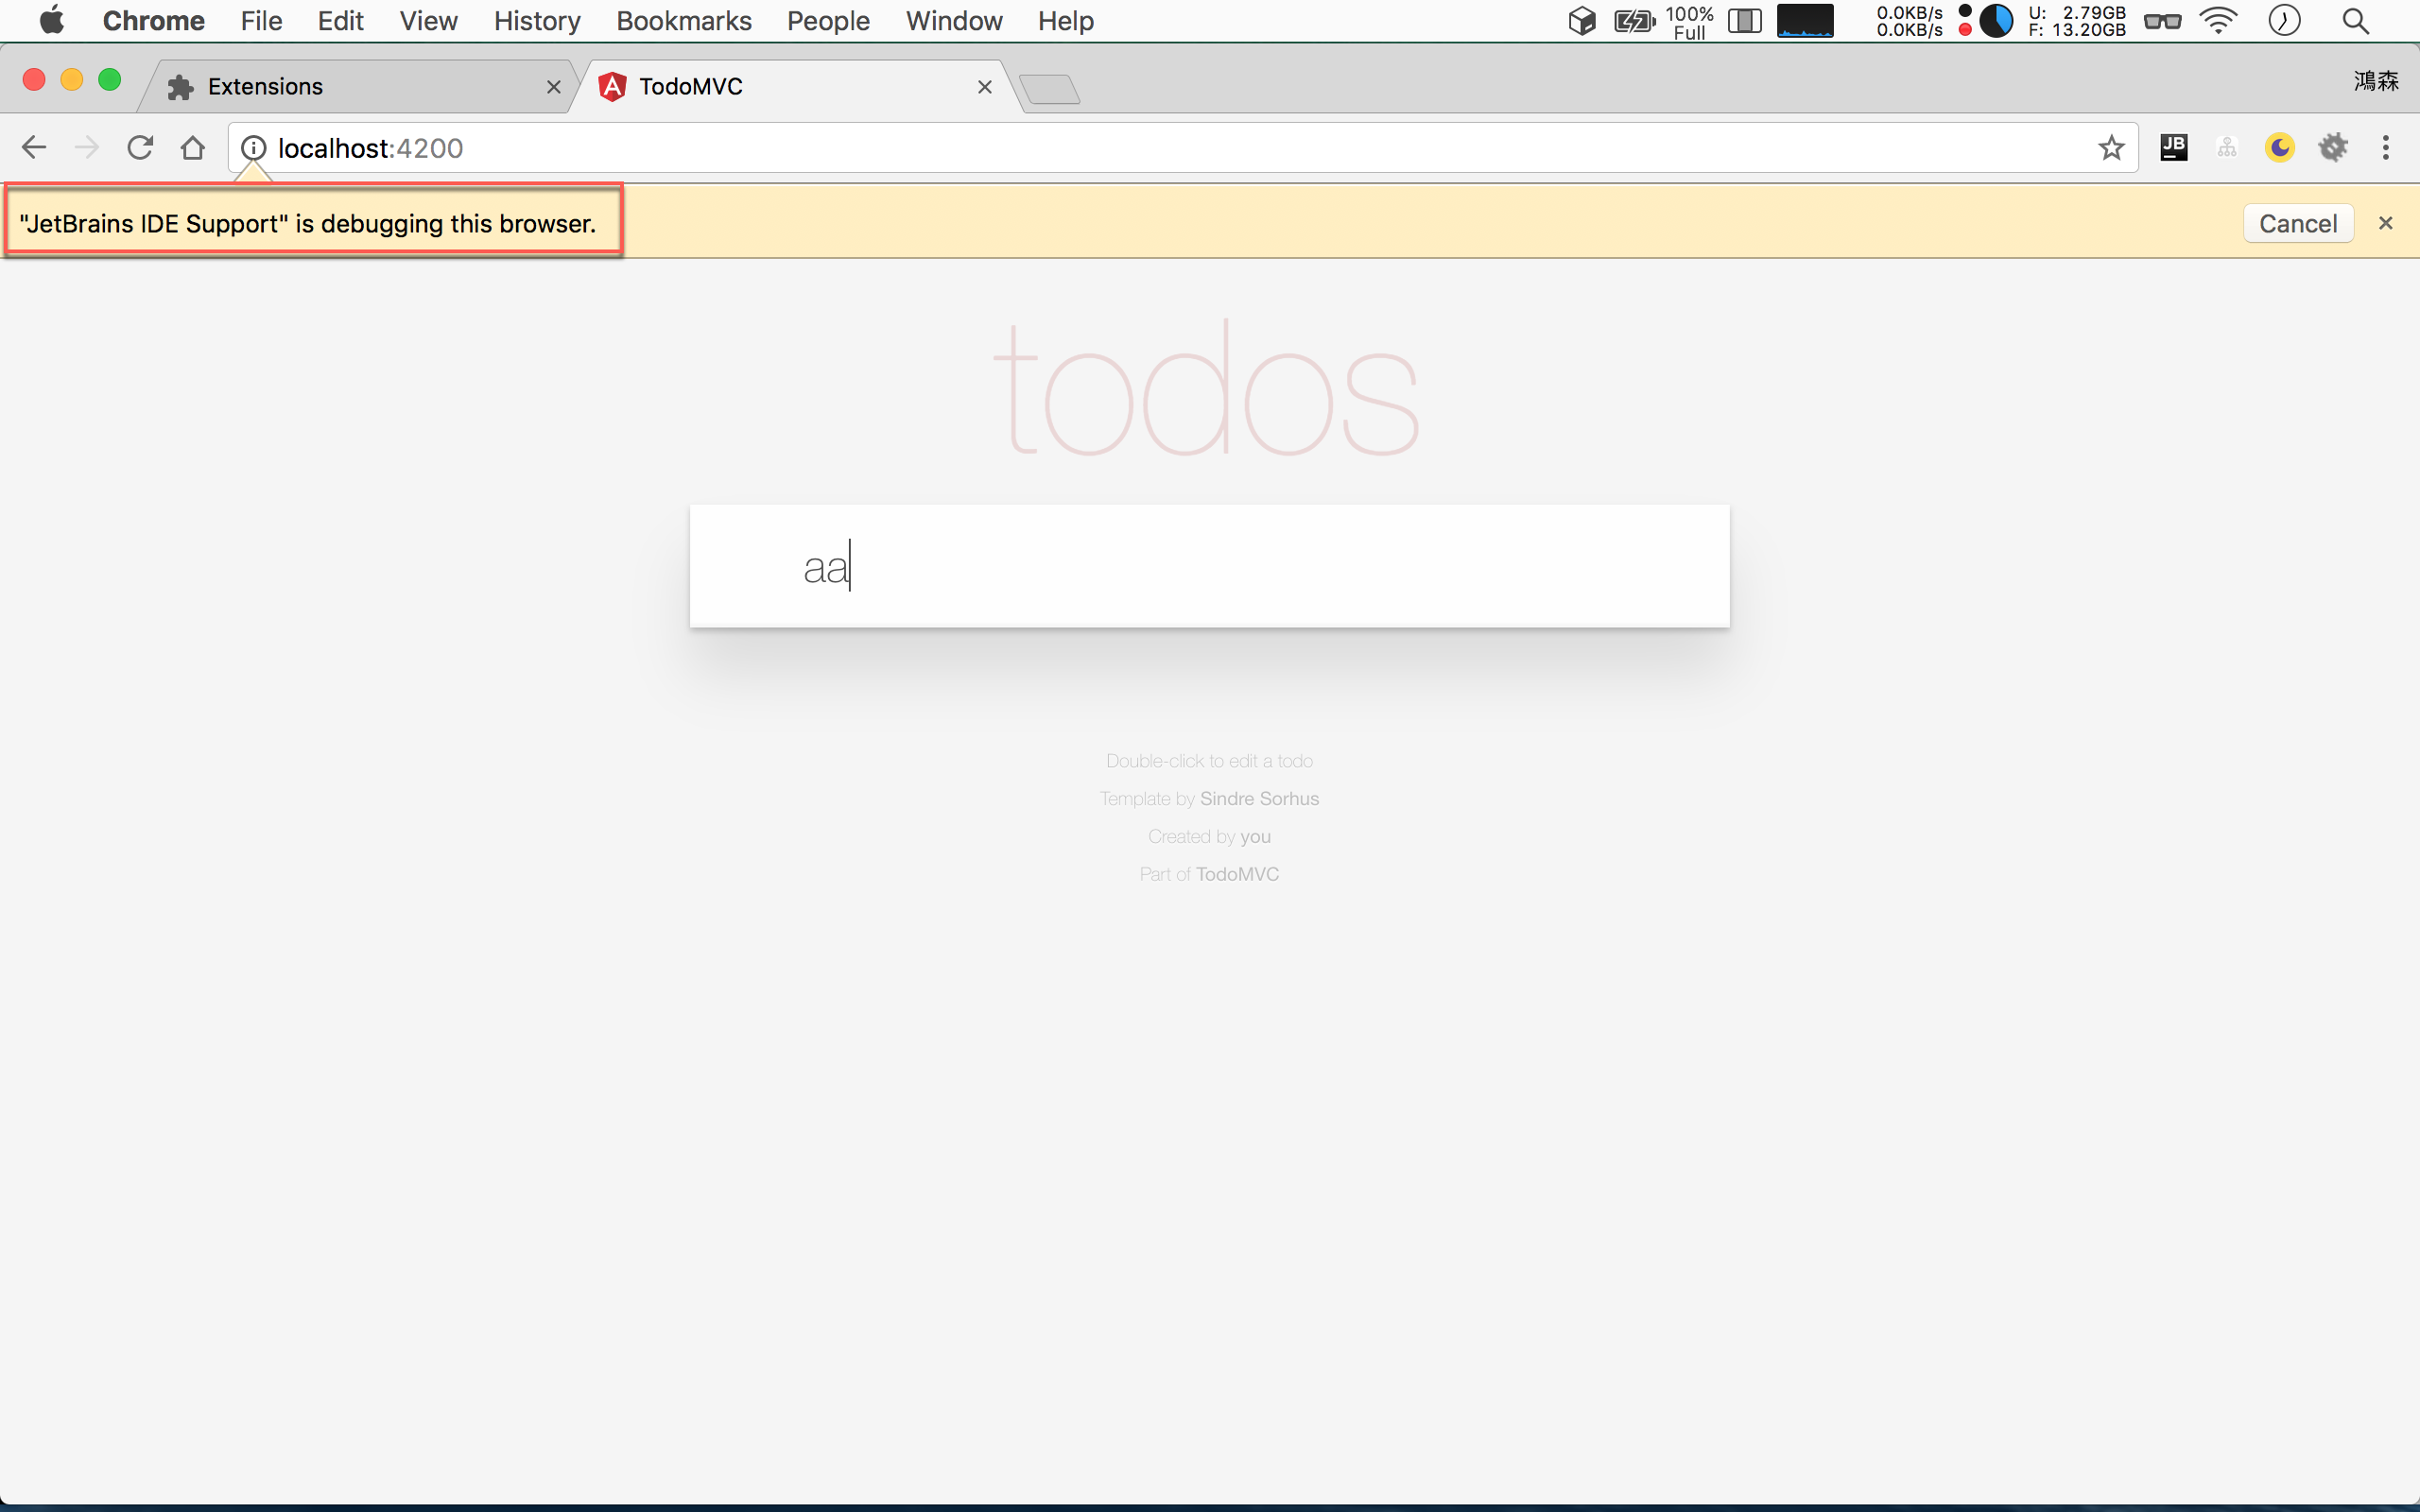
畫面會跳到 Chrome,並在上面顯示 JetBrains IDE Support is debugging this browser.
在 tod 輸入任何值,按 enter。
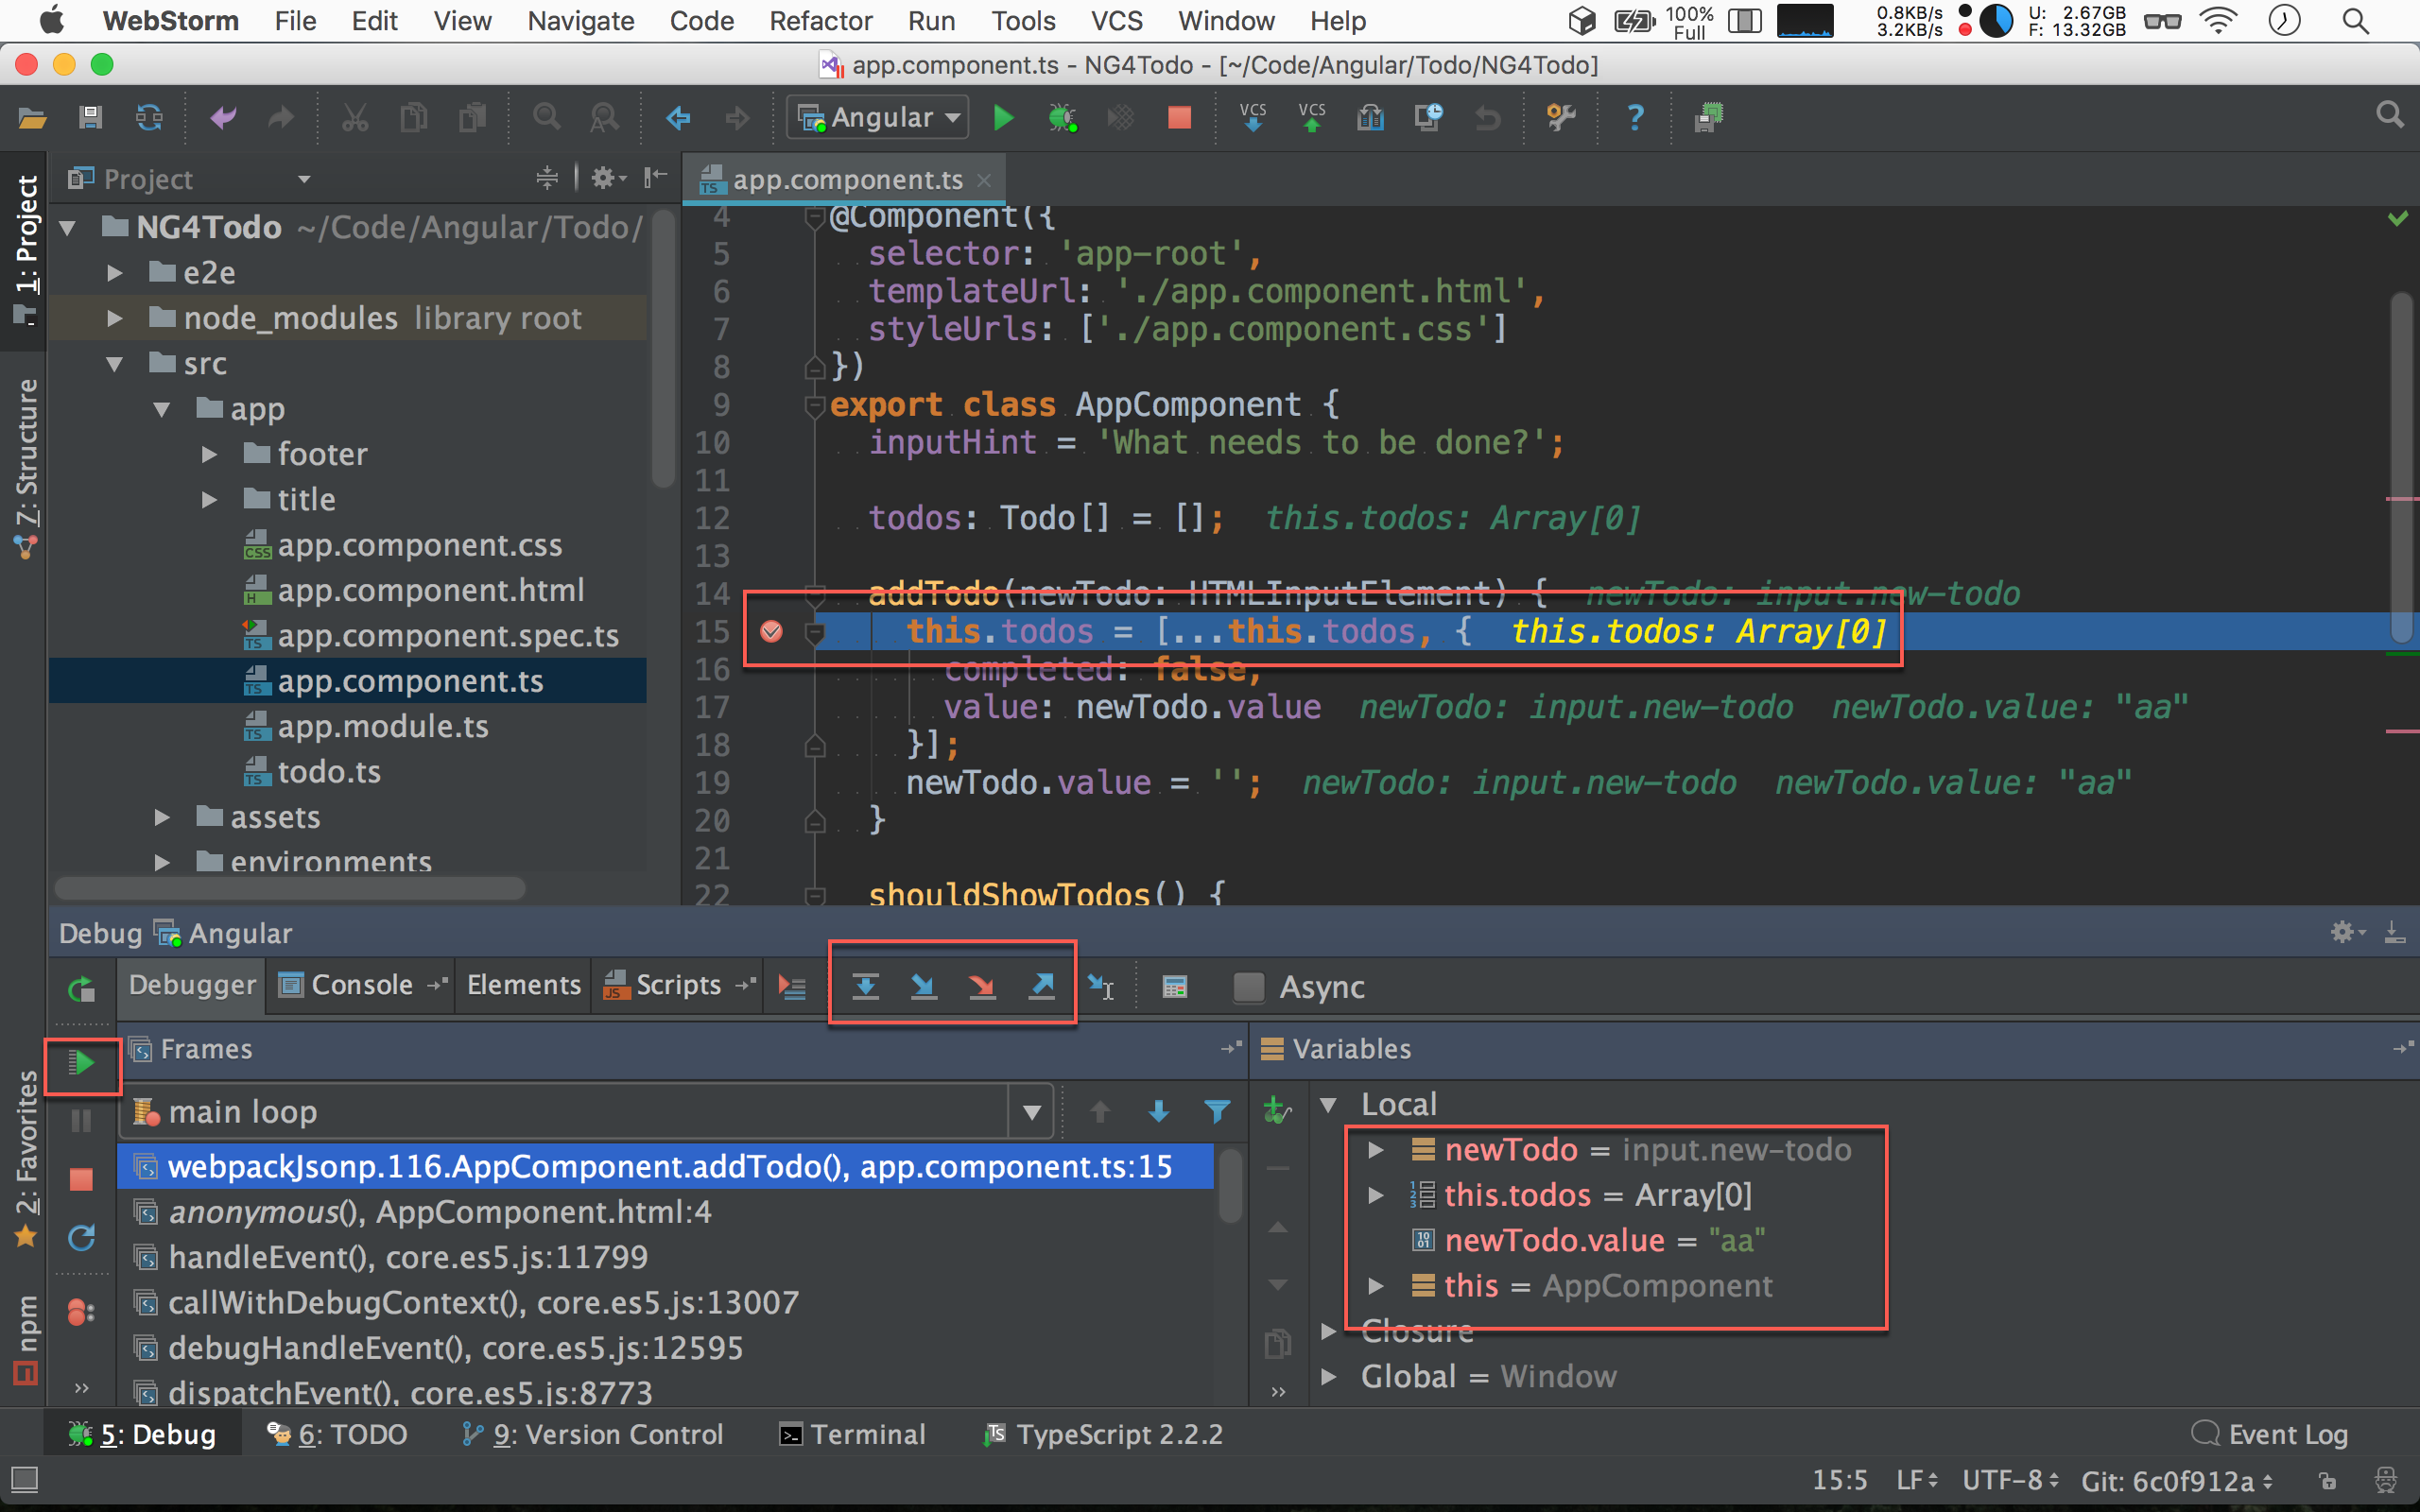
從 Chrome 自動跳回 WebStorm,並且停到中斷點,顯示目前所有變數與 call stack。
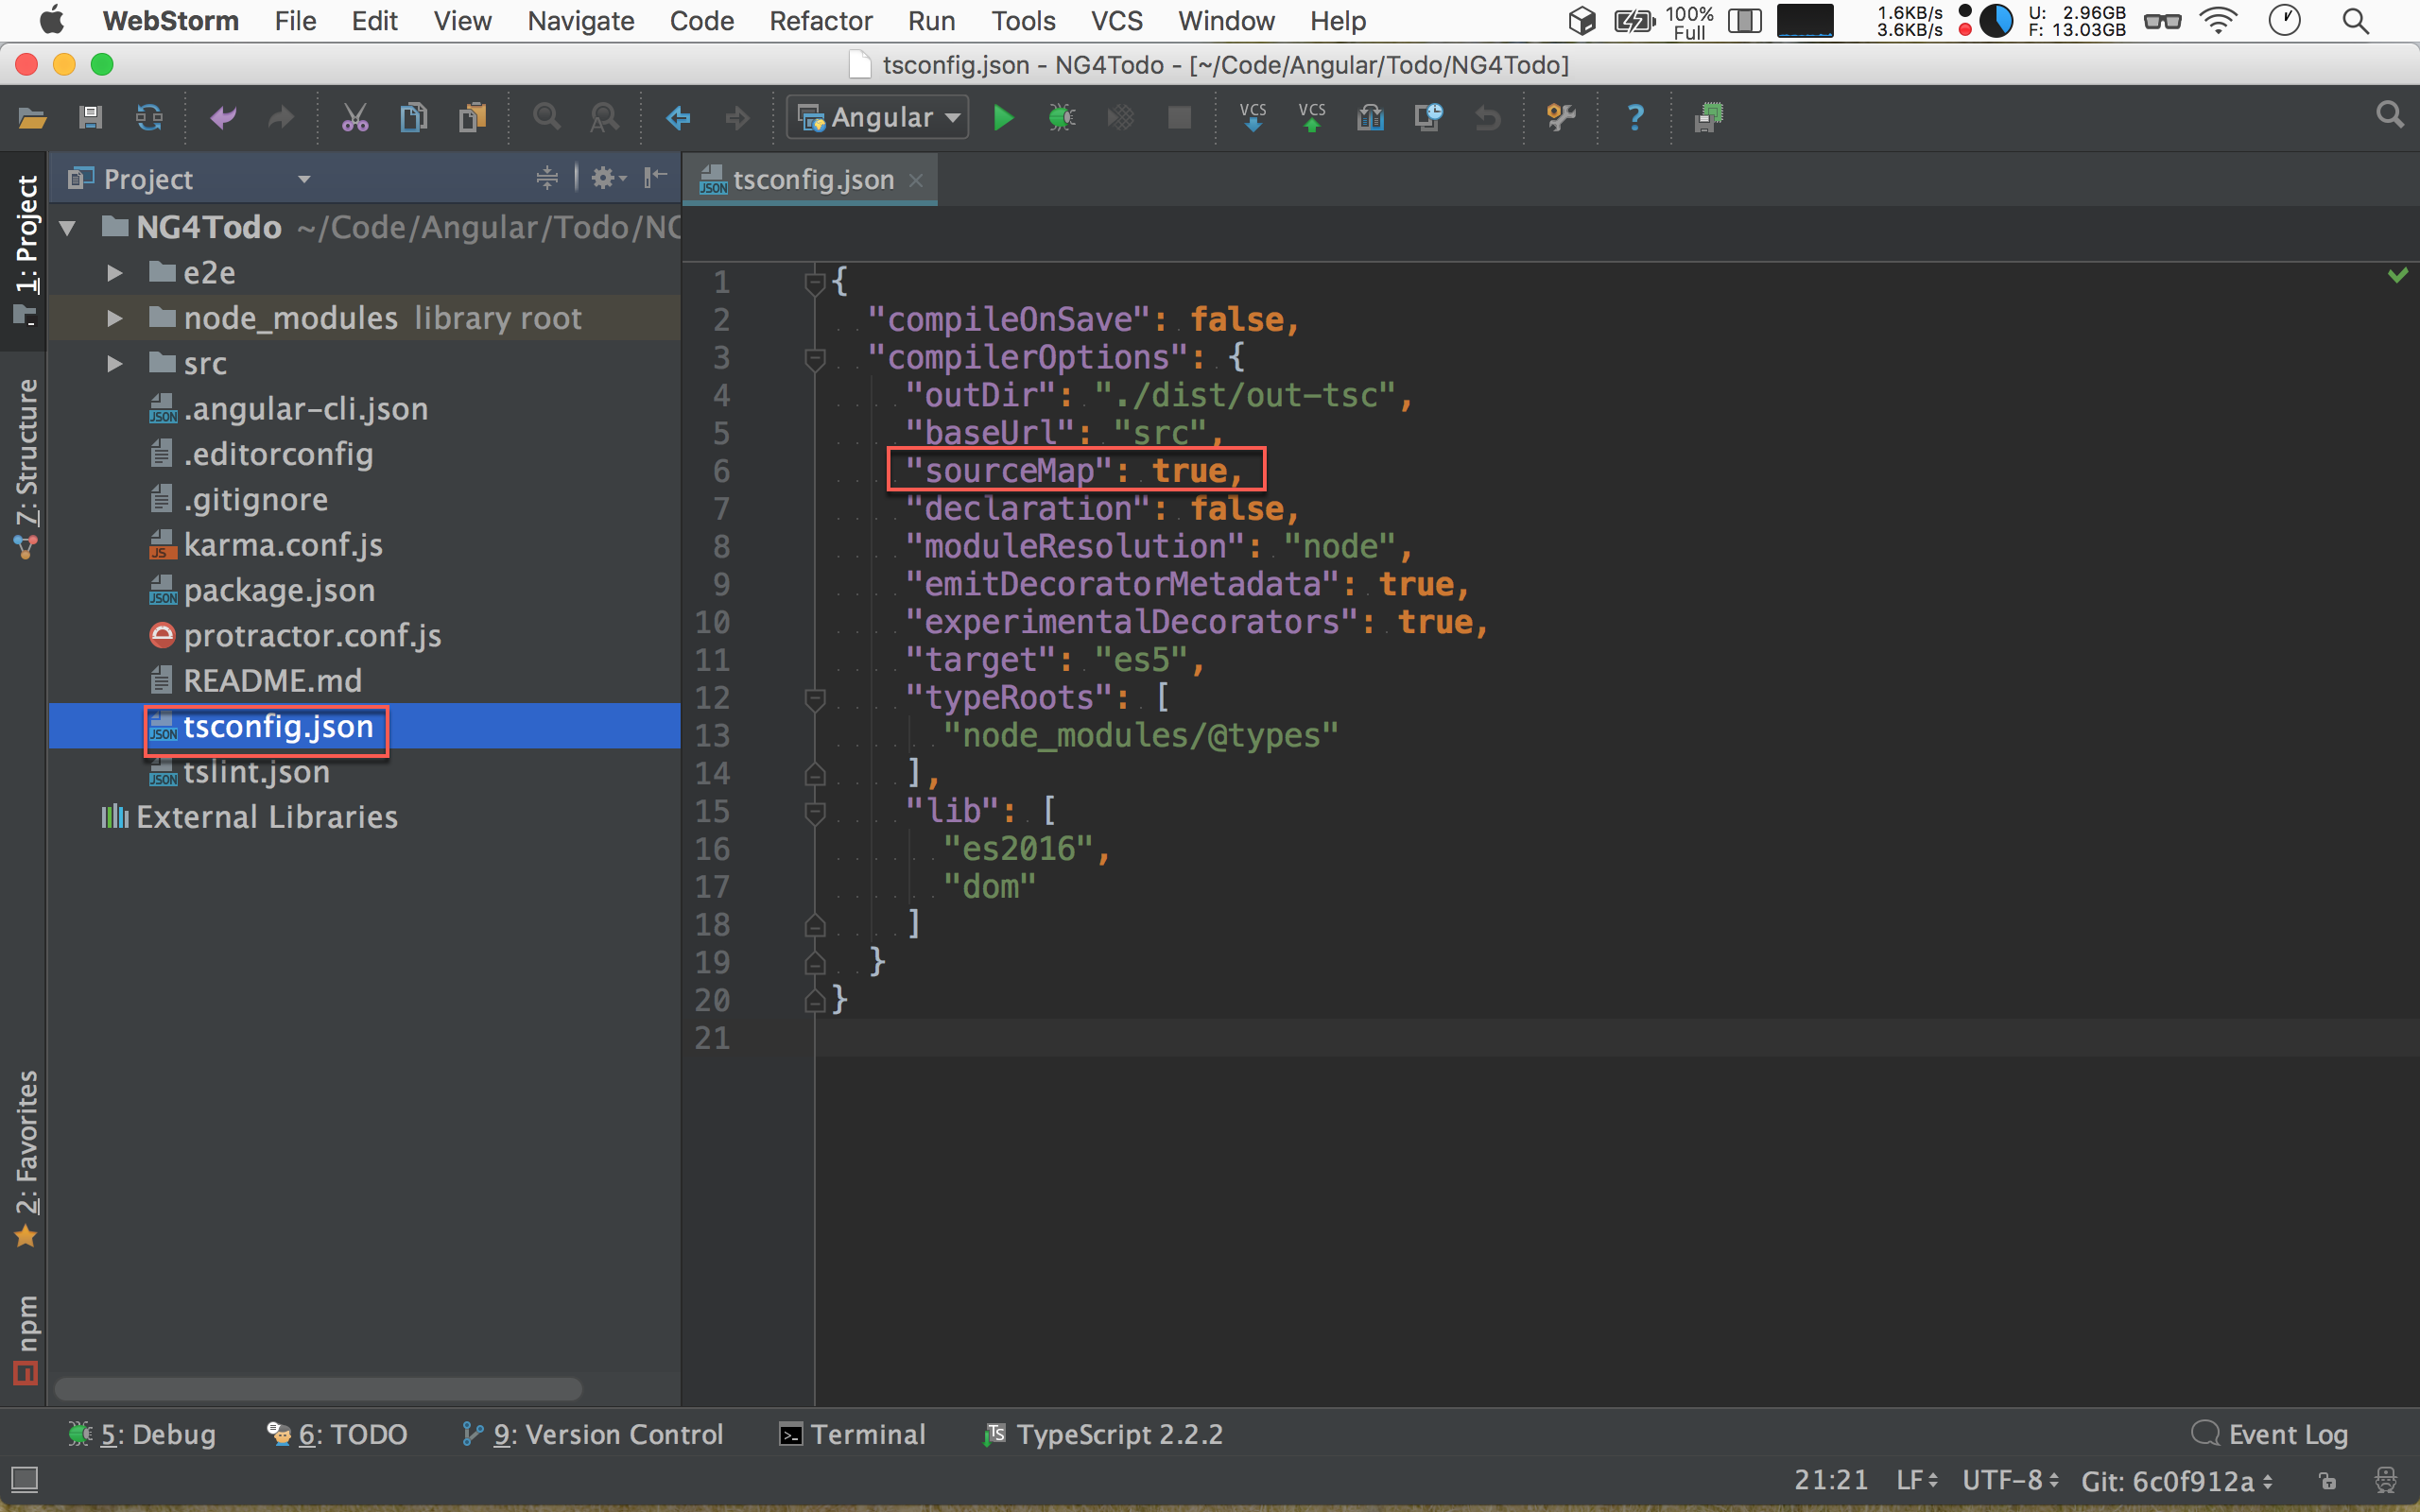
但這樣使用有個前提,就是要產生 source map,我們才有辦法透過 source map 將中斷點停在 TypeScript。
Conclusion
- 後端使用中斷點的 debug 經驗,一樣可以套用在 TypeScript 與 Angular。